The diagram shows a circle graph which shows the amount of homework done each day by Mr. Auckland's Grade 9 class. Based on the circle graph, what percentage of students do at least one hour of homework per day?
(A) (B) (C) (D) (E)
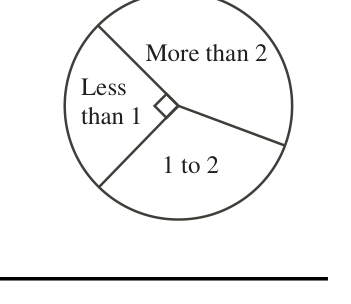
The diagram shows a circle graph which shows the amount of homework done each day by Mr. Auckland's Grade 9 class. Based on the circle graph, what percentage of students do at least one hour of homework per day?
(A) (B) (C) (D) (E)