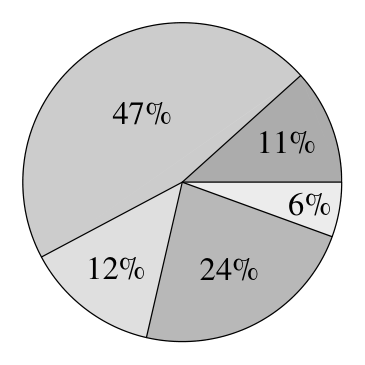
The pie chart shows how exactly 2000 children in a particular town get to school. Note that the percentages in this pie chart are exact, without any rounding. Approximately twice as many use a bicycle as use the bus. Roughly the same number come by car as walk. The rest come by train. How many children use the train?
Want a route through all this instead of an archive? The track
puts 2,604 problems in a working order, from Junior Challenge level to the IMO shortlist.