In the diagram, is the centre of the circle, is a diameter, and the circle graph illustrates the favourite season of 600 students. How many of the students surveyed chose Fall as their favourite season?
(A) (B) (C) (D) (E)
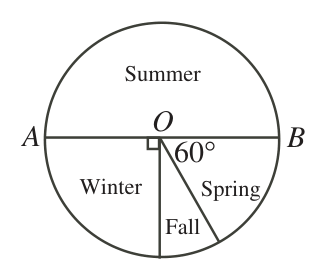
In the diagram, is the centre of the circle, is a diameter, and the circle graph illustrates the favourite season of 600 students. How many of the students surveyed chose Fall as their favourite season?
(A) (B) (C) (D) (E)